19 Most Valuable HR Metrics Making Data-Driven Decisions in 2026
HR metrics help companies understand what truly drives hiring, performance, and long term workforce stability. Many teams struggle because their data is scattered, unclear, or never turned into real action. In this guide, MOR Software will break down the most valuable metrics so you can track what matters, improve decisions, and build a stronger workforce with confidence.
What Are HR Metrics?
HR metrics are measurable values that show how well the human resource development team supports the organisation. They provide data on areas like hiring, retention, productivity, engagement, cost, and employee development. These measures also connect with broader human capital metrics, which help leaders understand the overall state of their workforce.
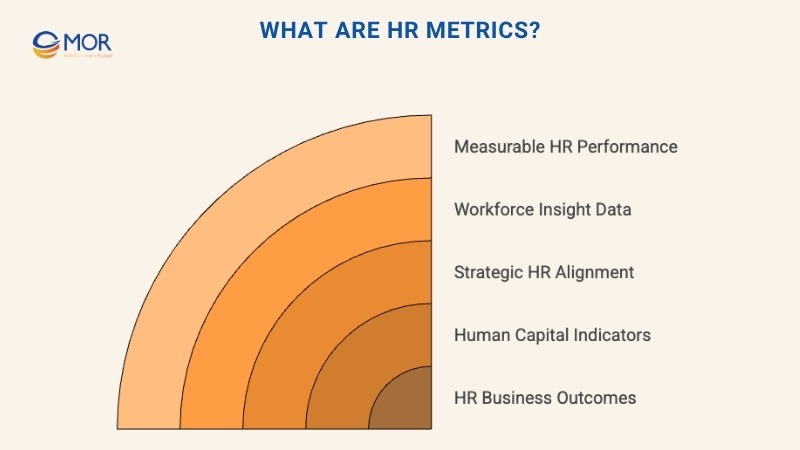
These indicators help HR teams work in a more strategic way because they link everyday people practices with clear business results.
Best HR Metrics To Track For Recruitment And Retention
Choosing the right HR metrics examples helps you understand how well your hiring and retention efforts are working. We’ll show you the key measures that reveal where your talent strategy is strong and where it needs attention.
Time To Hire
Time to hire is one of the most common HR metrics used in recruitment. It shows how many days pass between a candidate sending an application and accepting a job offer. This number helps HR understand how efficient the hiring steps are and what the candidate experience looks like.
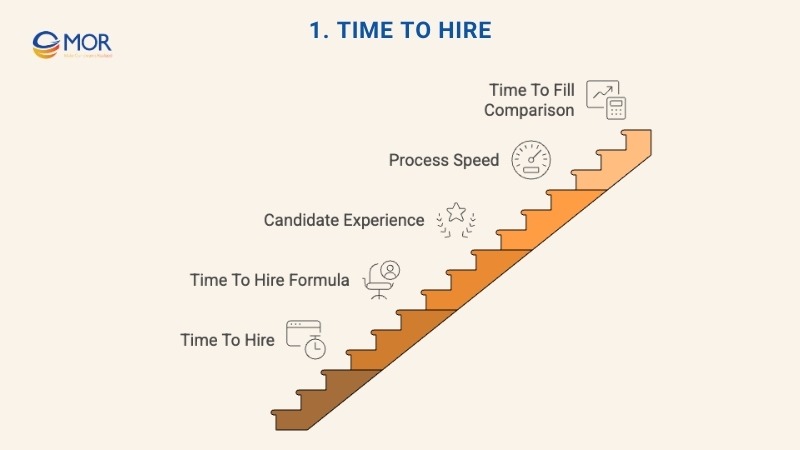
Here is the formula used to find the average time to hire:
Average time to hire = (1st candidate time to hire in days + 2nd candidate time to hire + nth candidate time to hire) / Total number of jobs
Recruitment automation efficiency shows how fast HR moves a candidate through screening, interviews, and final acceptance. When an organisation has a high time to hire, it often shows that the process is slow or not well organised.
A long time to hire can also harm the candidate experience. People may leave the hiring process if it takes too much time, and another company may hire them first.
Time to hire is different from time to fill. Time to fill counts the days between the approval of a job requisition and the moment a candidate accepts the offer. This method follows the definitions set by the Society for Human Resource Management and ISO 30414.
Cost Per Hire
Cost per hire is a recruiting metric that shows how much the company spends to bring new employees into the organisation. It also helps HR understand how efficient the hiring process is and if the workflow needs to be improved.
Working out the cost per hire can take time because you must add all internal recruiting costs and all external recruiting costs, then divide the total by the number of hires. The costs and the number of hires usually match a chosen period, for example one month or one year.
Cost per hire = (Internal costs + External costs) / Total number of hires
Below are examples of internal and external costs:
Internal costs | External costs |
| Cost of sourcing | Background checks |
| Recruitment team costs | Marketing costs |
| Administrative costs | Signing bonus |
| Hiring manager costs | Technological expenses |
Quality Of Hire
Quality of hire shows the value a new employee brings to the organisation. This HR metrics indicator helps HR understand how effective the recruitment process is and how much a new hire supports long-term company performance.
Quality of hire is usually measured through several factors. These include the new employee’s job results, their part in helping the team or organisation meet goals, how well they fit the company culture, and how long they stay with the company over time.
Early Turnover
Early turnover refers to the share of new employees who leave within their first year. Many teams see this as one of the most important HR metrics for judging hiring success. A high rate often shows a mismatch between the person and the company or between the person and the role.
New hire turnover also comes with a heavy cost. Most employees need 6 to 12 months to learn their tasks well and reach a strong productivity level. Replacing someone can cost 1.5 to 2 times the employee’s yearly salary, and the cost is even higher for senior positions.
Here is the formula for calculating early turnover:
Early turnover rate = (# of new hires who have left the organization during period / # of new hires from that same period) x 100
Employee Turnover
Turnover is a percentage that shows how many employees leave the company within a set year. When HR looks at this number together with a performance metric, it becomes easier to see the difference between high performers and low performers who decide to leave.
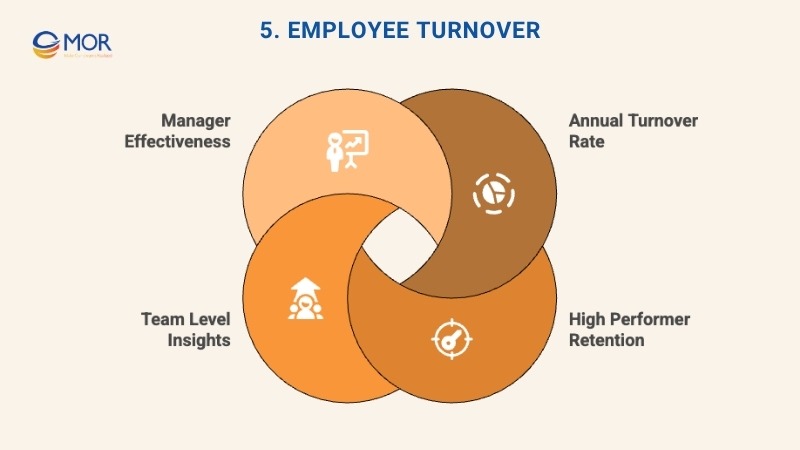
Ideally, you want low performers to move on and high performers to remain. This metric also gives HR clear insight into which teams people enjoy working in and which parts of the organisation employees prefer to avoid.
Turnover is valuable information when building hiring plans. It can also serve as an important indicator of a manager’s overall success.
Here is the formula used to calculate the employee turnover rate:
Turnover rate = (# Terminations during period / # Employees at beginning of period) x 100
>>> Highlight 20 leading platforms in 2026 to help you find the right employee engagement software that inspires teams and strengthens culture.
Time Between Promotions
This simple HR metrics measure helps explain why some high-potential employees choose to leave. It focuses on the average number of months since an employee last received an internal promotion.
Revenue Per Employee
The revenue per employee metric shows how productive the whole organisation is. It also reflects the overall strength and capability of the workforce.
This indicator looks at the organisation’s total revenue divided by the number of current employees. It is usually calculated each year:
Revenue per employee = Total revenue / Number of employees
It is helpful when comparing revenue per employee across different years and when checking how your organisation performs against competitors.
Performance And Potential
There are many ways to measure employee performance using both qualitative and quantitative methods. Some common metrics include Net Promoter Score, management by objectives, number of errors, 360 degree feedback, and forced ranking.
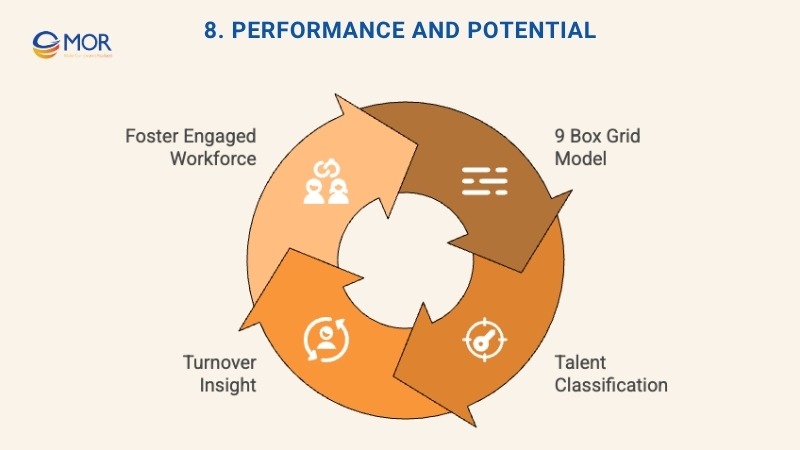
Another helpful method is the 9 box grid. This tool measures and places an employee’s performance and potential into three levels. It helps show which employees are underperformers, steady team members, high potentials, or top talent.
This model is useful when telling the difference between wanted and unwanted turnover.
Billable Hours
Billable hours per employee are one of the clearest performance measures and are especially important in professional service firms like law or consulting. When this performance metric is compared with engagement scores or other input measures, it can lead to useful insights. Checking this number across teams or between different managers or partners can also show clear differences in work patterns.
This metric is closely connected to the employee utilization rate, which describes how much of an employee’s working time is spent on tasks that can be billed.
HR Cost Per Employee
The cost of HR per employee is found by dividing the total HR operating costs by the number of employees in the organisation. It is usually shown in dollars and calculated for a set period, often once a year.
Total HR costs include all spending connected to HR work during that period. This covers HR staff salaries, HR systems and software, training and development, hiring costs, benefits administration, and any other expenses related to HR services.
Cost of HR per employee = Total HR costs / Total number of employees
HR To Staff Ratio
The HR to employee ratio is another HR metrics measure that shows how efficient the HR team is. It reflects how many HR professionals an organisation has compared to the total number of employees.
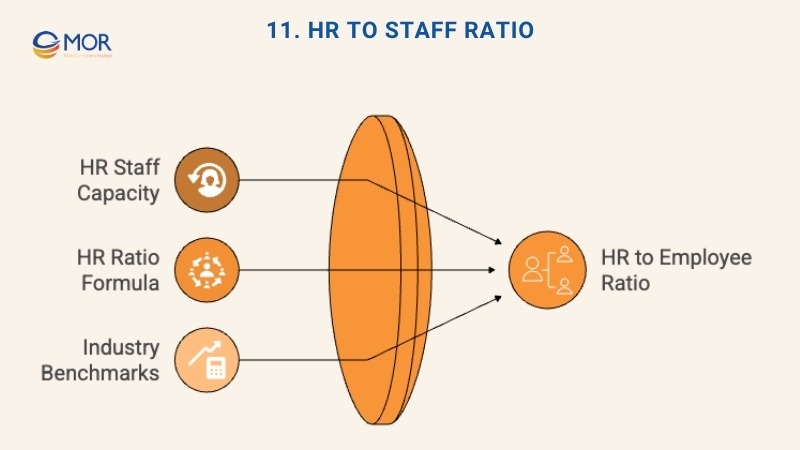
Research from the State of HR report shows that a common HR to employee ratio is about 1:50 or 2 percent. This means there are usually 2 HR staff members for every 100 employees.
HR to employee ratio = Number of HR employees / Total number of employees
The ideal ratio can change a lot based on the industry, how complex the HR needs are, the level of automation in HR tasks, and the specific duties handled by the HR team.
HR Business Partner Ratio
This metric works in a similar way to the HR to employee ratio, but it focuses only on HR business partners. It helps show how well the HR team can support the business in a strategic way and how prepared they are to guide different departments.
HR Software Effectiveness
The effectiveness of HR software is a more detailed HR metrics measure. For learning and development tools, effectiveness is often assessed through:
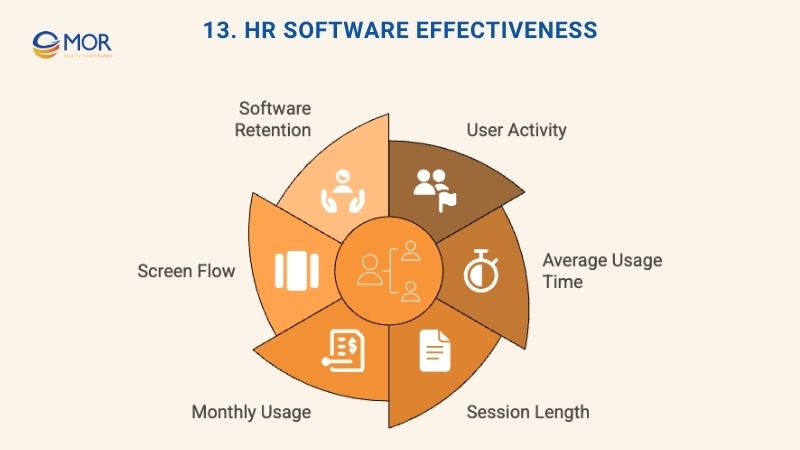
- The count of users who log in and use the platform
- The typical amount of time users stay on the platform
- How long each session lasts
- The total monthly usage time per user
- The order in which users move through screens
- How many users continue using the software over time
Absenteeism Rate
Absenteeism, like turnover, is a clear sign of employee dissatisfaction and can signal future turnover risks. The absenteeism rate helps HR spot early warnings and address issues before they grow, since long periods of absence can create high costs for the organisation.
Differences in absenteeism across managers or departments can also reveal early signs of problems or pressure points inside the company.
Here is the formula used to calculate the absenteeism rate:
Absenteeism rate = (Number of absent days / Total working days) x 100
Training Cost Per Employee
Training expenses per employee show the average amount of money an organisation spends on developing each worker during a set period, usually one year. This number helps HR understand how much the company invests in improving employee skills, knowledge, and abilities.

You can calculate training expenses per employee with this formula:
Training expenses per employee = Total training expenses / Total number of employees
Overtime Cost
Overtime expenses are the extra costs a company pays when employees work more hours than their normal schedule and receive higher pay rates, as required by labour rules or internal policies.
These costs are a direct part of labour spending and can make a noticeable difference in the payroll budget. For this reason, tracking overtime closely is important for planning and control.
Here is the formula for calculating overtime expenses:
Overtime expenses = Total overtime hours worked x Overtime pay rate
Employee Engagement Score
Soft HR metrics focus on the qualitative side of HR and help measure attitudes, behaviours, and how employees feel about their work. These indicators look at elements that are not always visible in numbers but still shape the workplace in a strong way.
Unlike hard HR metrics, which use clear numbers like turnover rates or cost per hire, soft HR metrics explore the personal experiences of employees. They often measure satisfaction, engagement, leadership quality, and the effects of training or development programs.
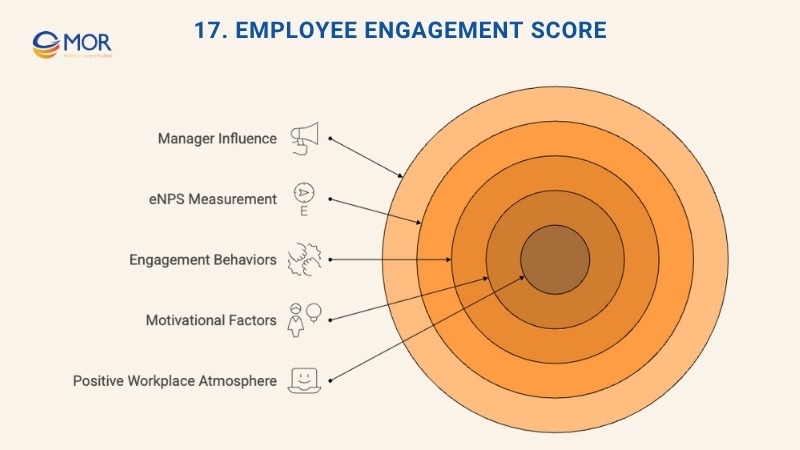
An engaged workforce is usually a productive one. Engagement is often seen as the most important soft HR outcome. People who enjoy their work and feel proud of their company tend to stay engaged, even when the workload is heavy or pressure is high.
Engaged employees usually perform better and view challenges as interesting instead of stressful. Team engagement is also a key sign of how well a manager leads their group.
Engagement rating is often measured through the employee net promoter score, or eNPS. This score shows how likely employees are to recommend the organisation as a good workplace to friends or family, using a scale from 1 to 10.
Job Satisfaction
Job satisfaction metrics help HR understand how happy and comfortable employees feel with their roles, their work setting, and the organisation overall.
This soft HR metrics measure is usually gathered through surveys and questionnaires. These tools ask employees about different parts of their job and workplace, including work life balance, how they see their managers, and how secure they feel in their position.
Leadership Score
The leadership score metric measures how leadership influences HR performance template, morale, and the overall climate within the organisation.
This indicator is often measured through 360 degree feedback surveys. In these surveys, employees rate their leaders on different leadership competencies, including communication, decision making, empathy, and the ability to inspire and motivate others.
Why Are HR Metrics Important?
Making the HR function more data-informed brings many advantages for HR work and for the whole organisation. Recent survey data suggests that 47% of HR teams already use analytics often or always to understand employee attitudes and behaviours, which shows how common this shift has become.
The points below explain why HR metrics matter and how they support long-term growth through HR metrics and analytics. This section also shows how best HR metrics help leaders act with more confidence.
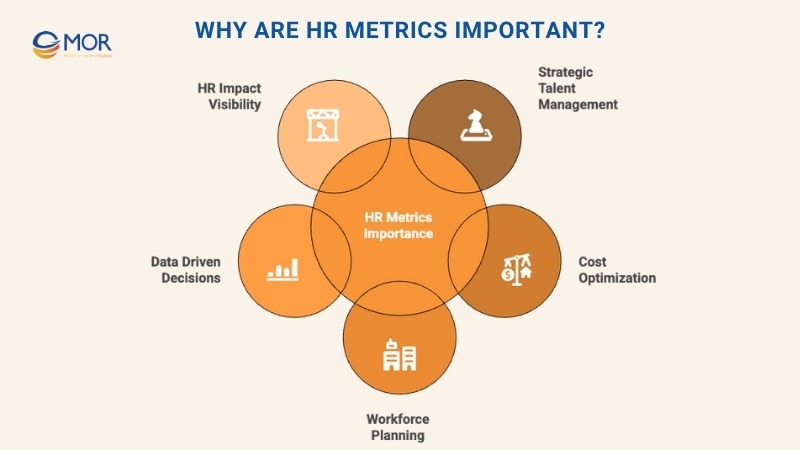
Strategically managing talent
HR metrics help teams understand talent needs and skill gaps, which guides decisions in talent acquisition, employee development, and retention. HR can use this information to shape talent programs that match real business needs and help the workforce grow stronger. This is important because LinkedIn data shows that skill sets for jobs have already changed by about 25% since 2015 and are expected to change twice as much by 2027. So HR needs metrics that keep pace with these rapid shifts in skills.
Optimizing costs
When HR studies hiring costs, training costs, and turnover costs, these numbers help them use budgets in a smarter way and find areas where spending can be lowered. This is important because research from the Society for Human Resource Management suggests that each employee departure can cost about one third of that worker's annual earnings once recruiter fees, temporary cover, and lost productivity are added up. It also helps HR show why investments in training and retention are worth it because the data supports the expected return.
Supporting strategic planning
HR metrics reveal clear trends and patterns that help leaders plan for the future. With these insights, HR can prepare workforce plans that match long-term business goals and make sure the organisation has the right people to handle future demands. Deloitte's 2023 Global Human Capital Trends survey, for example, found that 59% of leaders expect to focus on reimagination in the next two to four years. Therefore, clear workforce data is the key for planning bold changes instead of only reacting to short term pressures.
Improving decision-making
HR teams can rely on data from HR metrics to make stronger decisions based on evidence. When HR sees how wellness programs affect absenteeism, it becomes easier to decide whether to continue, change, or expand those programs to improve results. This move toward data supported choices reflects a wider pattern. McKinsey research shows that about 70% of company executives now treat people analytics as a top priority in their organisation.
Highlighting The Impact Of HR Initiatives On Organisational Performance
Tracking HR metrics and connecting them with business outcomes helps HR show the real value of their work. This makes the impact more visible, strengthens trust in HR, and helps secure leadership support for future plans.
In short, HR metrics act as clear tools for planning, forecasting, and preparing the workforce for what comes next.
How To Apply HR Metrics Effectively?
Having a strong set of HR metrics and turning them into clear actions is important for any organisation. Here are simple ways to apply these measures in a useful and practical way. This section also introduces the idea of using an HR metrics dashboard to make tracking easier.
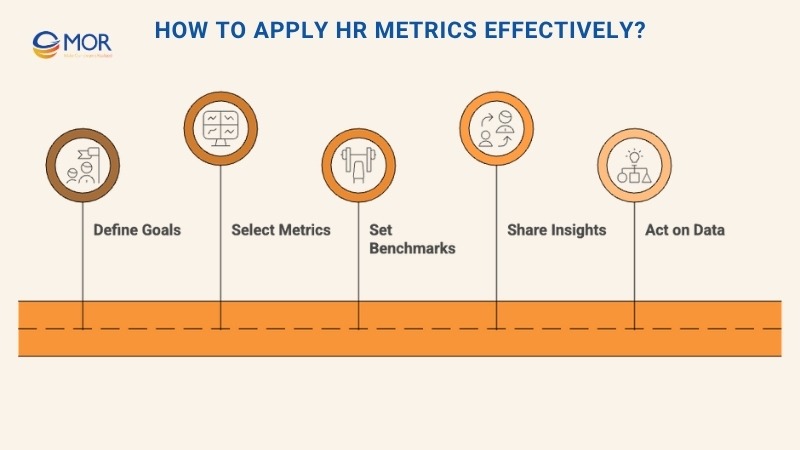
- Define your goals. Decide what you want to achieve with HR metrics. Your goal might be to improve recruitment results, strengthen retention, or raise overall performance in the organisation.
- Select meaningful metrics. Pick the indicators that match your goals and give useful information. Staying focused on the most important KPIs helps avoid unnecessary data.
- Set useful benchmarks. Compare your HR metrics with past results or industry standards to see where improvements are needed.
- Share insights clearly. Communicate important findings with leaders, teams, and other stakeholders so everyone understands what the data shows.
- Act on the data. Use HR metrics to spot trends, find root problems, and discover growth opportunities. Create focused plans based on what the data reveals.
Best Practices For Collecting And Reporting HR Metrics
Accurate and consistent data collection is important for producing reliable HR metrics. Below are the main steps to follow when gathering and reporting this information. This section also includes one mention of key HR metrics and HR statistics as planned.
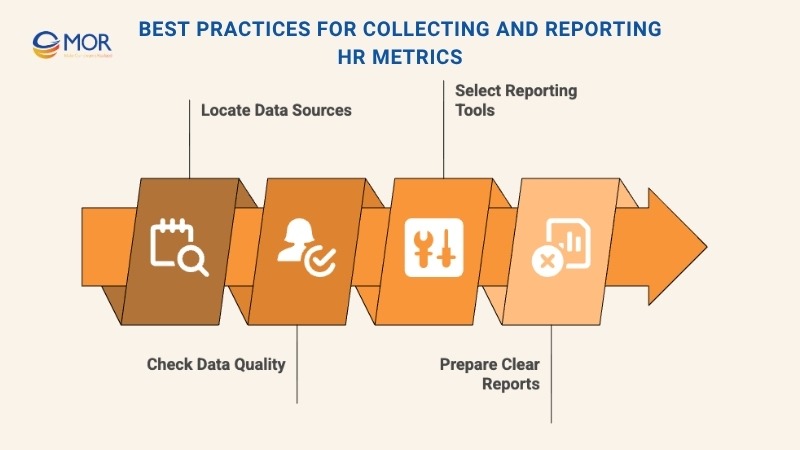
- Locate data sources: Find where your HR data is stored. This may include HRIS integration systems, performance tools, or employee surveys.
- Check data quality: Make sure the information is correct, consistent, and complete. Remove mistakes or outdated entries when needed.
- Select reporting tools: Choose the software or platforms that help you analyse HR metrics clearly, such as Excel, data dashboards, or HR analytics tools.
- Prepare clear reports: Build reports that are easy to read and that highlight important findings for leaders and other stakeholders.
Common Pitfalls In HR Metrics And How To Avoid Them
HR metrics are useful, but they can lead to wrong conclusions if they are not used with care. Below are common mistakes to avoid. This section also includes one planned mention of HR metrics formulas and HR benchmarks.
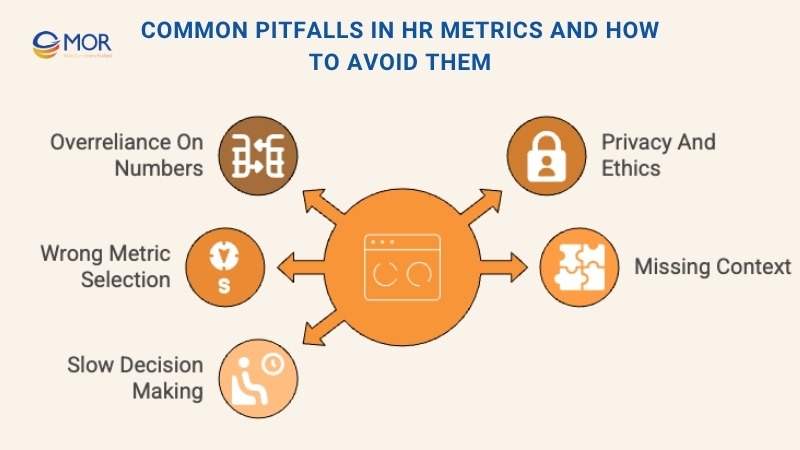
- Relying only on numbers: Combine quantitative data with qualitative insights to get a complete view.
- Overlooking privacy and ethics: Confirm that all data collection and analysis follow legal and ethical rules.
- Tracking the wrong metrics: Choose indicators that support real organisational goals, not just the ones that are easy to measure.
- Ignoring the bigger picture: Keep external events and organisational changes in mind when you interpret results.
- Delaying decisions: Avoid getting stuck in analysis. Use the data to guide action instead of reading HR metrics formulas without applying them.
Emerging Trends In HR Metrics
The field of HR metrics continues to grow and change. Below are some important trends to keep an eye on. This section also includes one planned mention of HR analytics metrics and workforce metrics and analytics.
Emerging Trends In HR Metrics
- Growth in HR technology: More teams are using HR software and digital tools to organise data collection and reporting.
- Focus on wellbeing and mental health: Organisations are paying closer attention to measures that reflect employee wellbeing and mental health.
- Shift to real time analytics: HR teams are moving from scheduled reports to continuous, real time insights.
- Use of AI and machine learning: Advanced algorithms help reveal deeper patterns and make stronger predictions.
- Rise of employee experience metrics: There is more attention on understanding and improving the full employee journey.
- Tracking DEI progress: Metrics related to diversity, equity, and inclusion continue to gain importance as organisations look to strengthen fairness and representation.
MOR Software Builds Scalable HR Systems For Modern Enterprises
MOR Software develops customized HR outsourcing technology platforms that help organizations manage their people data more effectively. Our goal is to give HR teams a single, reliable system that connects recruitment, performance, payroll management system, and employee engagement into one unified view.
We design every solution with scalability and real-time analytics in mind. From web and mobile applications to Salesforce-based HR systems, our software outsourcing helps businesses track workforce metrics, automate reporting, and make decisions grounded in data.
Each system is built with secure cloud infrastructure and AI-driven insights to forecast trends such as turnover, training needs, and employee satisfaction. By combining technology and human-centered design, we create digital tools that support stronger planning, smarter resource allocation, and a better employee experience overall.
MOR Software turns HR metrics into practical intelligence, helping companies make informed decisions and grow sustainably. Contact us to start building your HR platform today.
Conclusion
Strong HR metrics give companies a clear view of how their people work, grow, and stay engaged. When teams understand the right numbers, they make smarter choices and build a workforce that performs well in the long run. MOR Software helps organisations turn this data into practical action through scalable, secure, and easy to use HR systems. If you want a clearer way to track your workforce and plan for the future, contact us and start shaping your HR platform today.
"Solutions Director at MOR Software, has extensive expertise in software development and management. He leads innovative projects and provides strategic solutions to enhance business operations, helping clients achieve digital transformation goals."
Pham Huu Canh


Solutions Director
MOR SOFTWARE
Frequently Asked Questions (FAQs)
What are HR metrics?
HR metrics are data points used to measure how effectively a company manages its workforce. They track areas like recruitment, performance, engagement, and retention to support better decision-making.
Why are HR metrics important for businesses?
They help organizations make informed decisions, control costs, improve productivity, and align HR strategies with business goals. Without metrics, HR efforts often rely on assumptions rather than facts.
What are the most common HR metrics to track?
Popular HR metrics include time to hire, cost per hire, turnover rate, employee engagement score, absenteeism rate, and training investment per employee.
What’s the difference between ‘time to hire’ and ‘time to fill’?
Time to hire measures how long it takes from when a candidate applies to when they accept an offer. Time to fill tracks the total number of days from job requisition approval to the new hire’s acceptance.
How often should HR teams review their metrics?
Most organizations review HR metrics monthly or quarterly. Real-time dashboards are becoming more common, allowing teams to respond quickly to trends or issues.
How do HR metrics support employee retention?
By analyzing metrics such as turnover rate, engagement levels, and promotion timelines, HR can identify risk areas and take proactive steps to retain talent.
What tools are used to collect HR data?
HR data often comes from HRIS systems, payroll software, engagement surveys, and performance management platforms. Data visualization and analytics tools are then used for reporting.
Can small businesses benefit from tracking HR metrics?
Yes. Even small teams can use basic metrics like time to hire, absenteeism, or training hours to improve efficiency and workforce planning.
What’s the difference between hard and soft HR metrics?
Hard metrics are quantitative, such as turnover or revenue per employee. Soft metrics are qualitative, like engagement, satisfaction, or leadership effectiveness.
How can HR metrics improve company culture?
Tracking feedback, recognition, and engagement data gives leaders insight into employee sentiment. This helps create a more positive, inclusive, and productive workplace.
Share


Rate this article
0
over 5.0 based on 0 reviews
Your rating on this news:
Name
*Email
*Write your comment
*Send your comment
1