


What Is Data Quality Assessment? Framework, Process & Examples
Data can look valid in a database and still fail the business process that depends on it. A data quality assessment tests whether data is accurate, complete, consistent, current, valid, and usable for its intended purpose. This MOR Software guide will show you what to measure, how to assess it, how to score findings, and how to turn quality gaps into practical remediation work.
Key Takeaways
- A useful assessment connects technical data checks to real business use, risk, and decision requirements.
- Accuracy, completeness, consistency, timeliness, validity, and uniqueness give teams a practical basis for measurement.
- The work should end with clear scores, root causes, owners, remediation priorities, and ongoing monitoring rather than a one-time cleanup.
What Is Data Quality Assessment?
A data quality assessment is a structured review of whether data is fit for its intended business use. It checks technical defects and measures how those defects affect reporting, operations, compliance, analytics, customer processes, or AI systems.
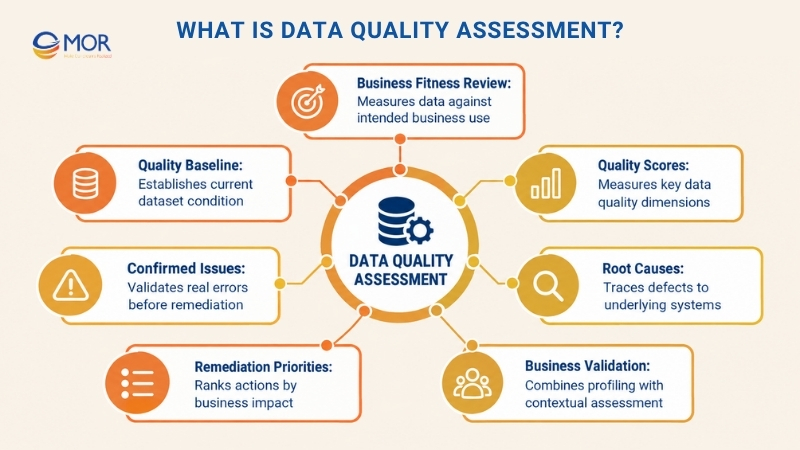
A typical assessment produces:
- Quality baseline: Current condition of the dataset before remediation
- Quality scores: Results for dimensions like accuracy, completeness, consistency, and timeliness
- Confirmed issues: Errors that have been validated rather than assumed from anomalies
- Root causes: Problems traced to source systems, integrations, transformations, or business processes
- Remediation priorities: Actions ranked by severity and business effect
Teams should define data quality assessment criteria before testing starts. Payment records may require 99.9% completeness, for example, while optional CRM profile fields can tolerate a lower threshold.
Data engineers, analysts, data stewards, owners, and business users often take part because technical checks alone can't determine whether data is truly usable.
Data profiling supports the assessment but has a narrower role. Profiling finds nulls, duplicates, distributions, ranges, and unusual patterns. A DQA interprets those findings against business rules and decides whether they require action.
Different data quality assessment methods combine automated checks with business validation for this reason. An unusual value may still be correct, while a properly formatted value may still be inaccurate.
The Importance of Data Quality Assessment
Poor data moves quickly through dashboards, APIs, ETL jobs, operational applications, and AI pipelines. Once that happens, one source error can affect many downstream decisions.
IBM reported in 2025 that 43% of surveyed chief operations officers identified data quality issues as their most pressing data management challenge.
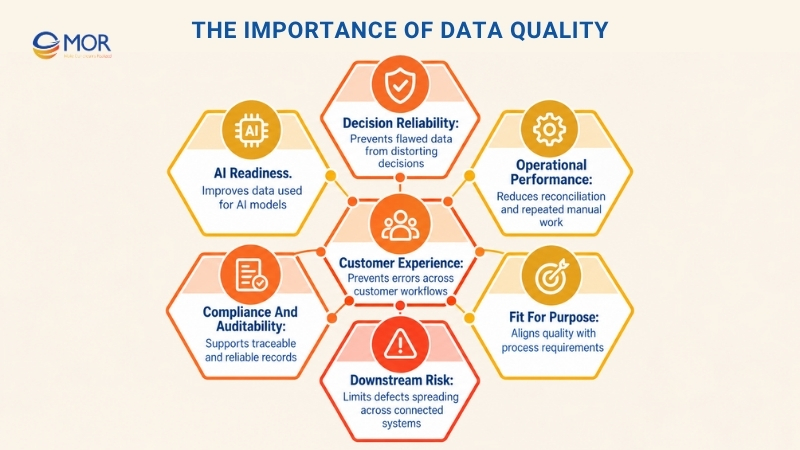
- Decision reliability: Incorrect or conflicting data can distort revenue reports, demand forecasts, inventory planning, and management dashboards. An assessment reveals where trust breaks before teams act on the numbers.
- AI readiness: Models learn patterns from the information they receive. Incomplete records, stale attributes, inconsistent labels, or duplicate entities can weaken model outputs. Teams preparing training datasets should also review data preprocessing in machine learning as part of the wider preparation process.
- Operational performance: Poor records create manual reconciliation, repeated checks, duplicate handling, failed transactions, and support work. DQA gives teams measurable targets for correcting the source.
- Compliance and auditability: Regulated processes need traceable definitions, controlled changes, and reliable records. Periodic data quality audits can test whether those controls still work as intended.
- Customer experience: Wrong addresses, duplicate customer accounts, missing order data, and conflicting profile details can break service workflows and personalization.
The goal isn't perfect data everywhere. The target is data that meets the requirements of the process using it.
What Data Quality Dimensions and Metrics Should Businesses Measure?
The six core dimensions are accuracy, completeness, consistency, timeliness, validity, and uniqueness. Gartner estimates that poor data quality costs organizations at least USD 12.9 million per year on average, so measurement should focus first on data tied to material business risk.
Dimension | What it tests | Example metric | Example rule | How to interpret the result | Typical business risk |
Accuracy | Whether a value matches reality or a trusted source | Verified records / checked records | Customer address matches the verified address source | A value can follow the right format and still be wrong | Incorrect decisions, billing errors, bad customer records |
Completeness | Whether required data is present | Populated required fields / expected fields | customer_id cannot be null | Apply completeness rules only to fields required for that business use | Missing reports, incomplete transactions, broken workflows |
Consistency | Whether related values agree across systems or datasets | Matching records / compared records | CRM country = billing country | Define the source of record when systems disagree | Conflicting reports, reconciliation work |
Timeliness | Whether data is current enough for its use | Data age or latency vs SLA | Inventory refreshed within 15 minutes | The acceptable delay depends on the process. Fraud detection needs fresher data than monthly reporting | Stale decisions, delayed actions |
Validity | Whether values follow expected types, formats, ranges, or rules | Valid records / total records | Date follows YYYY-MM-DD | Validity confirms rule compliance, not whether the value reflects reality | Processing failures, rejected records |
Uniqueness | Whether each business entity appears once at the required grain | Unique records / total records | customer_id must be unique | Define the correct business key before measuring duplicates | Double counting, duplicate profiles, distorted revenue |
Accuracy and validity are often confused. Accuracy asks whether the value is correct, while validity asks whether it follows the defined rule.
Thresholds also need business context. A 100% target may make sense for payment account IDs but add little value for optional CRM profile fields.
Other dimensions can include integrity, reliability, relevance, precision, and traceability. Add them only when they support a real business requirement or a defined data quality assessment objective.
Which Data Quality Frameworks and Standards Can Businesses Use?
A data quality assessment framework gives teams a common structure for defining rules, tests, responsibilities, and evidence. No single standard fits every data domain, so the choice should match the dataset and its use.
Standard or model | Primary focus | Useful when | How it supports DQA |
DAMA-DMBOK | Enterprise data management | Building governance programs | Provides shared data management and quality practices |
ISO 8000 | Information and data quality | Formal data quality programs | Defines requirements for quality, master data, and data rules |
IMF DQAF | Statistical data | Public-sector and statistical datasets | Reviews integrity, accuracy, serviceability, and accessibility |
USAID-style DQA | Monitoring and evaluation | Program and performance reporting | Uses validity, integrity, precision, reliability, and timeliness |
Organization-specific model | Business-defined requirements | Operational enterprise data | Converts internal rules into measurable checks |
ISO 8000 is a series rather than one generic checklist. ISO/TS 8000-82:2022 focuses on creating machine-processable data rules and also describes how profiling contributes to those rules.
The IMF DQAF takes a different approach for official statistics. Its top-level structure covers prerequisites of quality, integrity, methodological soundness, accuracy and reliability, serviceability, and accessibility.
Enterprise teams often combine established standards with internal rules. A retailer, for example, may use common completeness and accuracy principles but define its own freshness limits for stock, orders, pricing, and fulfillment.
Governance also matters once those rules span cloud systems. MOR Software's guide to cloud data governance covers ownership, access, policy, and control issues around distributed data.
How to Conduct a Data Quality Assessment in 7 Steps
A practical data quality assessment process starts before anyone runs a SQL query. Scope, business purpose, ownership, and acceptable quality must be set first, or the team can produce hundreds of technically correct checks that don't answer a useful question.
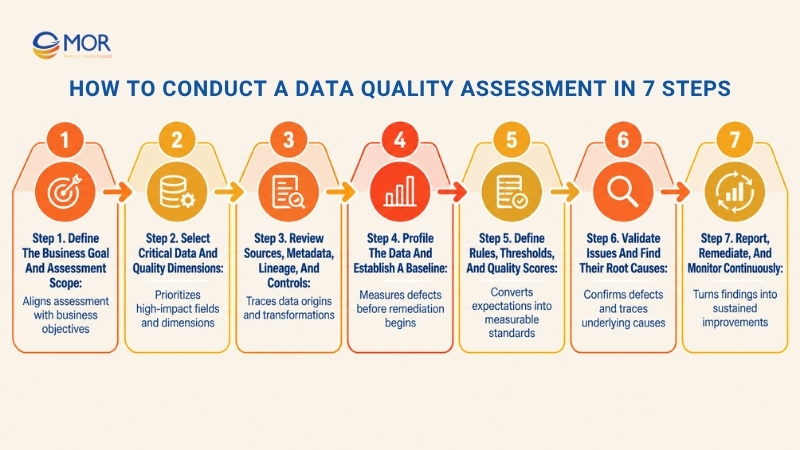
Step 1. Define the Business Goal and Assessment Scope
Start with the decision or process that depends on the data. A sales forecast, regulatory report, recommendation model, billing workflow, and customer service application all need different levels of quality.
Keep the first scope tight enough to finish. A useful data quality assessment checklist at this stage records the objective, datasets, systems, owners, business users, time period, exclusions, and acceptance thresholds.
- Business objective: State what the dataset must support and what failure would mean.
- Scope: List databases, tables, fields, reports, applications, and business units included.
- Stakeholders: Name data owners, engineers, analysts, stewards, and end users.
- Success criteria: Define the questions the assessment must answer.
- Scope control: Start with datasets tied to revenue, compliance, operations, or high-value analytics.
A narrow first assessment often produces better decisions than an enterprise-wide scan. It also gives the team a repeatable model that can expand later.
Step 2. Select Critical Data and Quality Dimensions
Not every column deserves the same attention. Identify critical data elements first, then map the relevant dimensions to each one.
A customer ID may need strict uniqueness and validity. Inventory quantity may need stronger accuracy and timeliness, while an AI training label may need domain-specific consistency checks and review.
- Critical elements: Pick fields that directly affect business outcomes.
- Relevant dimensions: Match each field to accuracy, completeness, consistency, timeliness, validity, uniqueness, or another justified dimension.
- Risk weighting: Give higher weight to regulatory, financial, customer, and operational data.
- Ownership: Assign responsibility for each high-priority dataset and rule.
AI projects make this step increasingly relevant. McKinsey's 2025 survey found that 88% of respondents said their organizations used AI in at least one business function, but only 7% reported that AI was fully scaled across the organization. Data requirements become harder as pilots move into production workflows.
For labeled AI datasets, teams can also assess annotation consistency through data labeling quality assurance tools.
Step 3. Review Sources, Metadata, Lineage, and Controls
Map where the data starts and every system that changes it before consumption. This step often reveals that the visible error isn't the original error.
A customer status may begin in Salesforce, pass through an API, enter an ETL job, land in PostgreSQL, and then appear in a BI dashboard. One incorrect mapping anywhere in that chain can create a valid-looking but wrong value.
- Source systems: Record the origin of each high-priority field.
- Metadata: Check schemas, definitions, types, accepted ranges, and reference values.
- Lineage: Trace transformations, joins, calculations, and system handoffs.
- Existing controls: Review validation rules, monitoring jobs, previous assessments, and documentation.
- System of record: State which source wins when systems disagree.
Cross-system quality becomes especially relevant for analytics. Our guide to business intelligence solution integration explains how disconnected data sources can affect reporting workflows.
Documenting lineage now also makes root-cause work much faster later. Without it, teams often waste time fixing downstream tables while the source continues generating the same error.
Step 4. Profile the Data and Establish a Baseline
Profiling gives the assessment a measurable starting point. Examine the schema, row counts, distributions, missing values, duplicates, frequencies, ranges, relationships, and unusual patterns before changing anything.
Different data quality assessment techniques work better for different defects. SQL checks are useful for deterministic rules, statistical profiling can expose unexpected distributions, and cross-table validation catches contradictions that a single-table test misses.
- Structure: Confirm field types, lengths, formats, keys, and relationships.
- Missing values: Measure null rates against fields that are truly required.
- Duplicates: Test unique keys and composite business keys.
- Distribution: Review frequencies, ranges, and category balance.
- Outliers: Flag values far outside expected operational patterns.
- Baseline: Save the starting scores before remediation begins.
Practical data quality assessment null values detection methods should distinguish mandatory fields, optional fields, and conditional requirements. A null delivery_date may be valid for an unshipped order but unacceptable once the order status changes to completed.
If you’re cleaning an existing dataset, you can also compare suitable data hygiene tools for deduplication, validation, enrichment, and standardization.
Step 5. Define Rules, Thresholds, and Quality Scores
Turn business expectations into rules that a person or system can test. Each rule needs a target, measurement logic, and failure condition.
For example, 'customer records should be complete' is too vague. 'At least 99% of active B2B customers must contain a valid billing country and tax identifier' can be measured.
- Rules: Write testable conditions based on business requirements.
- Thresholds: Set the minimum acceptable result for each rule.
- Scoring: Convert pass and fail results into percentages or weighted scores.
- Weighting: Give higher value to fields tied to larger business risk.
- SLA alignment: Match freshness and latency targets to operational needs.
- Failure criteria: Define when a result requires investigation or escalation.
Avoid defaulting to 100%. One missing optional preference field may carry almost no cost, while one incorrect payment account could warrant immediate action.
A score becomes useful only when teams know what the number represents. Document the formula, included rules, weighting, denominator, exclusions, and threshold so another analyst can reproduce it.
Step 6. Validate Issues and Find Their Root Causes
Automated tests produce candidates for review. They don't prove every flagged record is wrong.
Take an unusual order amount. It may be a genuine wholesale purchase rather than an outlier caused by a decimal error, so a business owner should confirm the meaning before anyone changes it.
- Confirm findings: Separate actual failures from legitimate exceptions.
- Cross-check: Compare records with trusted internal or external references.
- Business validation: Ask domain owners to confirm unusual values.
- Root-cause analysis: Trace errors back to entry, integration, ETL logic, transformations, or master data.
- Affected assets: Identify reports, applications, customers, or models that consume the faulty data.
- Priority: Rank issues by business effect and exposure, not record count alone.
This is where data analysis quality assurance becomes practical. Analysts should confirm that the rules, queries, joins, calculations, and samples used during the assessment don't create misleading findings of their own.
One recurring trap is correcting a warehouse record without checking the upstream CRM, ERP, or source API. The warehouse looks clean for a day, then the next pipeline run recreates the same defect.
Step 7. Report, Remediate, and Monitor Continuously
Turn findings into work that named owners can complete. Every major problem should connect to a cause, priority, responsible person, target date, and verification method.
Remediation can involve cleansing data, correcting application validation, changing ETL logic, reconciling source systems, fixing API mappings, improving reference data, or rewriting business rules.
- Report findings: Present scores, failed rules, causes, and affected processes.
- Assign actions: Name the owner for every priority item.
- Set priority: Fix issues tied to higher financial, regulatory, or operational exposure first.
- Prevent recurrence: Correct upstream logic instead of relying on repeated cleanup.
- Monitor rules: Automate stable tests where manual review adds little value.
- Reassess: Revisit thresholds when products, sources, or business requirements change.
A mature program turns the initial data quality assessment into a baseline. Later checks can then show whether remediation actually improved the dataset or only moved the problem elsewhere.
How to Score and Prioritize Data Quality Issues
A useful data quality assessment should tell stakeholders how serious each problem is, not simply count failed tests. The score needs to connect technical failure rates with business exposure.
That matters because trust is already weak in many organizations. A Precisely and Drexel University survey of more than 550 data and analytics professionals found that 67% didn't completely trust the data used for decision-making.
Measurement | Example | Purpose |
Rule pass rate | 98.5% | Shows compliance with one rule |
Dimension score | Completeness: 96% | Summarizes one quality dimension |
Dataset health score | 92/100 | Gives an overall baseline |
Business effect | High / Medium / Low | Shows operational exposure |
Issue severity | Priority 1 / 2 / 3 | Guides remediation order |
Trend | 96% → 93% | Shows quality regression |
A basic data quality assessment example makes the logic easier to see. Assume a customer table scores 99% for validity, 96% for completeness, and 82% for uniqueness because duplicate profiles are common.
A simple average would produce 92.3%. Yet that figure may hide the real problem if duplicates create double billing or duplicate customer communications.
Weighting solves part of that problem. If uniqueness carries greater business risk, give it more weight than a low-risk optional field.
Thresholds should also trigger action. A dataset can remain 'green' above 98%, move to review between 95% and 98%, and require immediate remediation below 95%, provided those levels match the business process.
Keep scoring formulas visible. Stakeholders need to understand why a score changed, which rules contributed, and which correction would move it back into the acceptable range.
What Should a Data Quality Assessment Report Include?
The data quality assessment report should turn technical findings into information each audience can act on. Executives need risk and priority, while engineers need failed rules, lineage, root causes, and technical evidence.
Report section | What to include | Primary audience |
Executive summary | Overall health, major risks, priority actions | Executives |
Scope and objectives | Systems, datasets, use cases, exclusions | All stakeholders |
Methodology | Dimensions, metrics, sampling, tools, and rules | Data teams |
Quality scores | Dataset and dimension results | Business and data teams |
Key findings | Confirmed quality issues | Data owners |
Business effect | Affected processes, reports, customers, and risk | Leadership |
Root causes | Where and why failures start | Engineers and stewards |
Recommendations | Corrective and preventive work | Owners |
Action roadmap | Priority, owner, due date, status | Program leaders |
Monitoring plan | Rules, thresholds, alerts, review cadence | Governance teams |
Keep the executive section concise and move technical evidence into supporting sections. Each major issue should include its business effect, owner, target date, and unresolved risks, while the original baseline should remain in the report so future data quality assessment cycles can measure real improvement.
How to Choose Data Quality Assessment Tools
A data quality assessment tool should support the type of checking your team actually needs. A small dataset may only require SQL and spreadsheets, but high-volume pipelines need more automation, lineage, alerting, and rule management.
Capability | Why it matters |
Data profiling | Detects distributions, nulls, duplicates, and anomalies |
Rule-based testing | Turns requirements into repeatable checks |
Cross-system validation | Tests agreement across databases and applications |
Custom metrics | Supports company-specific quality definitions |
Quality scoring | Creates measurable baselines |
Dashboards | Gives owners a shared view of data health |
Alerts | Flags regression after the initial assessment |
Lineage integration | Helps trace failures to their source |
Workflow and ownership | Assigns remediation work |
API / pipeline integration | Runs checks inside ETL, ELT, and CI/CD processes |
SQL remains useful when rules are explicit and the scope is manageable. Tests like NOT NULL, uniqueness checks, value ranges, referential integrity, and row reconciliation are easy to explain and audit.
Larger environments usually need monitoring that adapts as data changes. Monte Carlo's 2026 analysis of more than 11 million tables found that teams using anomaly-detection monitors required 40% fewer manual updates than teams relying on SQL or static validation.
Still, automated anomaly detection shouldn't replace explicit business rules. A system may spot that transaction volume looks unusual, but it won't know whether a regulatory field must always be populated unless you define that requirement.
Look for explainable checks, lineage, integrations, clear ownership, rule history, and usable reporting. The 'best' platform is the one that supports your operating model without creating a second system nobody maintains.
Common Data Quality Assessment Pitfalls and How to Fix Them
A data quality assessment can fail even when the technical checks are accurate. Scope, ownership, thresholds, and remediation design often determine whether the work changes anything after the report is published.
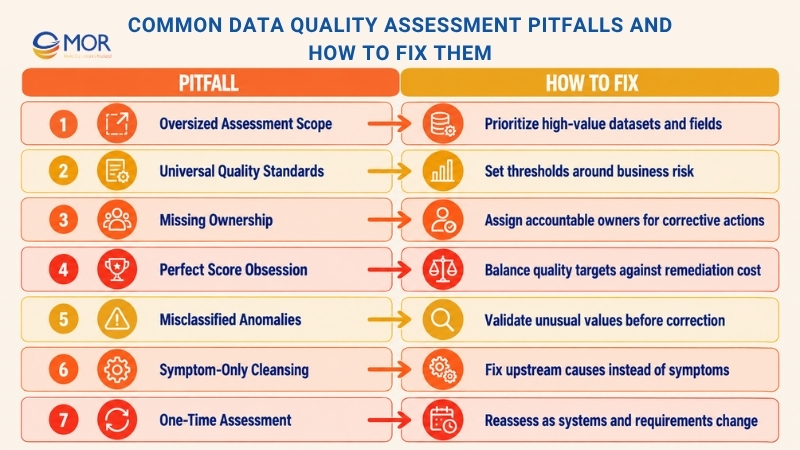
- Assessing too much data at once: Large scopes consume time and create long lists of low-value findings. Start with datasets and fields tied to revenue, compliance, reporting, AI, or operational processes.
- Using one standard for every dataset: A universal 99% rule ignores how different data is used. Set thresholds around the business process, acceptable risk, and cost of failure.
- Leaving findings without owners: An issue with no accountable person usually stays open. Assign data owners or stewards to high-priority datasets, rules, and corrective actions.
- Chasing perfect scores: Reaching 100% may cost more than the remaining errors are worth. Define acceptable quality based on exposure and the value of correcting the defect.
- Treating every anomaly as an error: Statistical outliers can be valid business events. Check them against source records, domain rules, and knowledgeable users before changing data.
- Cleaning records without fixing the source: Repeated cleansing treats the symptom. Trace defects through lineage and correct broken forms, integrations, ETL logic, APIs, or transformation rules upstream.
- Buying tools before defining rules: Software can run tests, but it can't decide what 'good' means for your order process or customer model. Define rules, thresholds, ownership, and remediation flow before automating them.
- Keeping noisy alerts: A monitor that fires every day and rarely requires action trains users to ignore it. Adjust thresholds, remove low-value checks, and keep alerts tied to a meaningful response.
- Treating DQA as a one-time project: Schemas, sources, products, and business rules change. Schedule reassessment for high-risk datasets and rerun checks after major migrations or integration changes.
These fixes keep the assessment tied to business decisions instead of turning it into another technical report that gathers dust.
How MOR Software Helps Businesses Improve Data Quality
A DQA can identify duplicate records, broken synchronization, weak validation, or outdated systems, but those findings may require software changes rather than another round of cleansing. At MOR Software JSC, we support that remediation through IT consulting, software architecture consulting, application modernization, Process Quality Assurance, QC & Testing, and system integration.
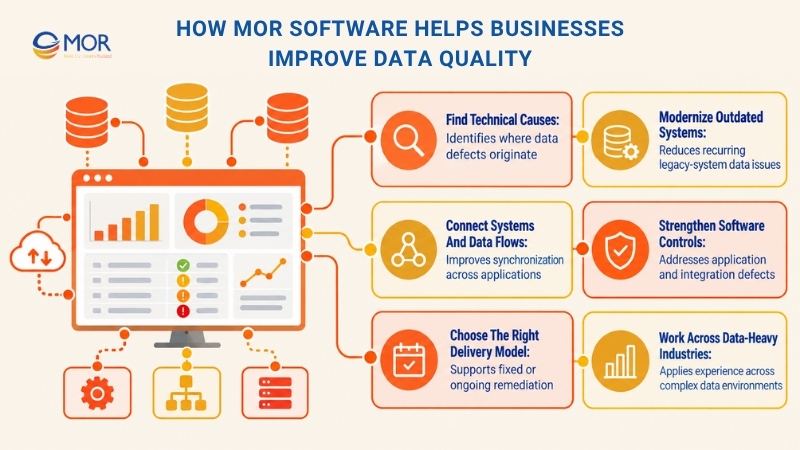
- Find technical causes: Our business analysis and IT consulting work reviews workflows, requirements, and system constraints to locate where incorrect or inconsistent data enters the process.
- Modernize outdated systems: Software architecture consulting and application modernization support businesses dealing with legacy applications, fragmented systems, or technical debt that keeps recreating data problems.
- Connect systems and data flows: API, ETL, and migration work can correct gaps between applications. In one Salesforce project, our team integrated a legacy PitTouch system with Salesforce, created an API Gateway, and used ETL for migration. The delivered system improved real-time data synchronization and accuracy.
- Strengthen software controls: Process Quality Assurance consulting and QC & Testing fit projects where defects originate in applications, integrations, or release processes.
- Choose the right delivery model: MOR supports project-based development and Offshore Development Center models for fixed remediation scopes or longer engineering needs.
- Work across data-heavy industries: Our documented experience spans finance and banking, manufacturing, HRM, healthcare, telecommunications, media and entertainment, and food and beverage. MOR Software also holds ISO 9001:2015 and ISO 27001:2013 certifications.
If your data quality assessment points to legacy systems, integration gaps, or weak software controls, Contact us to map the findings into a practical consulting, modernization, integration, or development plan.
Conclusion
A data quality assessment turns uncertain data into measurable evidence about accuracy, completeness, consistency, timeliness, validity, and usability. Strong programs connect those findings to root causes, owners, remediation work, and ongoing monitoring instead of stopping at a score.
If poor data traces back to integration gaps, legacy software, or weak system controls, you can contact us to discuss how MOR Software can turn those findings into practical consulting, integration, modernization, or development work.
"Learn from the past, embrace the present, and look forward to the future. The key is to never stop questioning."
Le Manh Hung


CTO MOR Software
MOR SOFTWARE
Frequently Asked Questions (FAQs)
What is a data quality assessment?
A data quality assessment evaluates whether data is suitable for a defined business purpose. It measures areas like accuracy, completeness, consistency, timeliness, validity, and uniqueness, then connects failures to business risk. The output normally includes a baseline, quality scores, confirmed defects, causes, remediation priorities, and owners.
What are the main dimensions of a data quality assessment?
The six common dimensions are accuracy, completeness, consistency, timeliness, validity, and uniqueness. Organizations may add integrity, relevance, reliability, precision, or traceability when required. The right set depends on the dataset's use, because an inventory feed, regulatory report, CRM record, and AI training dataset don't share identical quality requirements.
How do you perform a data quality assessment?
Define the business objective and scope, select critical data, map relevant dimensions, review sources and lineage, profile the data, set rules and thresholds, test records, validate findings, trace root causes, score results, and create remediation actions. The assessment should then move into monitoring so teams can detect later regression.
What is the difference between data profiling and data quality assessment?
Data profiling describes the dataset through null rates, duplicates, distributions, value ranges, patterns, and structural statistics. DQA goes further by judging those findings against business rules and intended use. A profiler can identify 5% missing addresses; the assessment determines whether that failure affects delivery, reporting, customer service, or another process.
How do you calculate a data quality score?
Start with measurable rules and calculate the share of records or tests that pass. Teams can group these results into dimension scores, then create an overall score through simple averaging or weighted scoring. Weighting works better when some fields carry greater financial, regulatory, operational, or customer risk than others.
What should be included in a data quality assessment checklist?
Include the business objective, scope, datasets, critical fields, owners, quality dimensions, source systems, lineage, rules, thresholds, profiling checks, validation method, scoring logic, business risk, remediation owner, target date, and monitoring plan. A checklist should guide repeatable work rather than become a long inventory of checks with no decision attached.
What should a data quality assessment report contain?
The report should contain an executive summary, scope, assessment method, dataset baseline, dimension scores, failed rules, confirmed findings, affected business processes, root causes, priority levels, recommendations, owners, due dates, and a monitoring plan. Technical evidence can sit in supporting sections so executive readers can focus on decisions and risk.
How often should a data quality assessment be performed?
Frequency should follow business risk and the rate of change. High-risk datasets may need continuous rules plus scheduled formal reviews. Lower-risk reference data may need less frequent assessment. Run additional reviews after major migrations, schema changes, ERP or CRM integrations, new regulations, or changes to business definitions.
What tools are used for data quality assessment?
Teams use SQL, spreadsheets, profiling tools, data observability platforms, validation libraries, ETL tools, data catalogs, and custom scripts. Tool choice depends on data volume, source complexity, monitoring frequency, lineage needs, and ownership requirements. Start with the required checks first, then select technology that can run and maintain them reliably.
How do you prioritize issues found during a data quality assessment?
Combine technical severity with business exposure. Give priority to defects that affect revenue, compliance, customers, operational continuity, executive reporting, or production AI. Also consider how many downstream assets depend on the faulty data and whether the same source keeps recreating the issue. Error count alone rarely gives the right remediation order.
Share


Make Our-Dreams Realized


© 2023 . MOR Software. All Rights Reserved
Sitemap
Privacy Policy
Terms of Use

Rate this article
0
over 5.0 based on 0 reviews
Your rating on this news:
Name
*Email
*Write your comment
*Send your comment
1