


Top 20+ Data Science Techniques to Know and Apply in Practice
Businesses collect vast amounts of data, yet turning it into reliable decisions remains difficult. Data science techniques help teams uncover patterns, predict outcomes, and solve problems using statistical analysis and machine learning. In this guide, MOR Software will explain the core methods, their practical applications, and how to select the right approach for your business needs.
Key Takeaways
- Data science combines statistical analysis, data preparation, predictive modeling, and machine learning to extract useful information from raw datasets.
- The right method depends on the business objective, available data, expected output, and model performance requirements.
- Companies apply these methods to forecast demand, detect fraud, understand customers, automate processes, and measure business performance.
An Overview of Fundamental Data Science Techniques
Data science techniques are statistical, mathematical, and computational methods used to collect, process, analyze, and interpret data. They help organizations discover relationships, identify unusual patterns, forecast future events, and make decisions based on evidence.
Data science combines several fields, including statistics, computer science, and machine learning. Statistical methods explain patterns and uncertainty, programming handles data processing, and machine learning builds models that learn relationships from historical records.
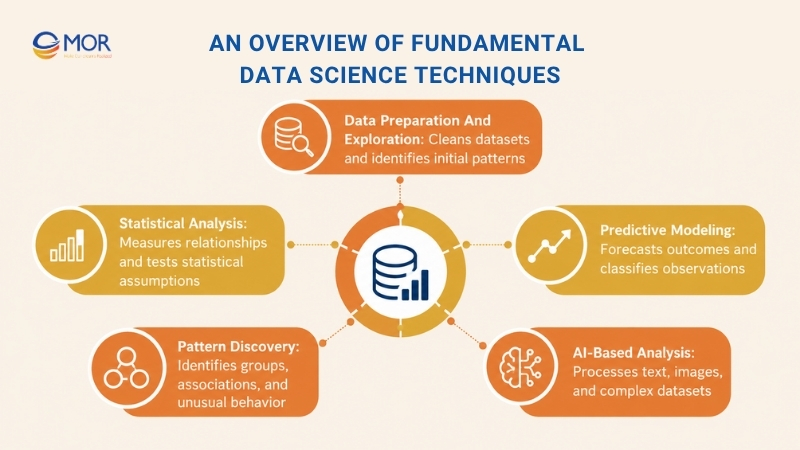
The main categories of data science methods include:
- Data preparation and exploration: Clean datasets, examine distributions, and identify patterns before analysis
- Statistical analysis: Measure relationships, test assumptions, and estimate uncertainty
- Predictive modeling: Forecast numerical values or classify observations
- Pattern discovery: Identify customer groups, associations, and unusual behavior
- AI-based analysis: Process text, images, and complex datasets through machine learning models
The distinction between data science tools and techniques is also worth understanding. Regression and clustering are techniques, whereas Python, R, SQL, and Apache Spark are tools used to implement them.
Similarly, data science vs data analytics comes down to scope. Data analytics generally focuses on examining data to answer business questions, whereas data science also includes building predictive models and data-driven systems.
Why Data Science Techniques Matter for Modern Businesses
Business data keeps growing across CRM platforms, transaction systems, connected devices, and customer applications. Companies need reliable analytics and data science techniques to turn these records into information that supports planning and daily operations.
The demand is already visible. According to McKinsey's State of AI 2025 survey, 88% of respondents reported regular AI use in at least one business function. Reliable data analysis remains a necessary part of building and testing many of these systems.
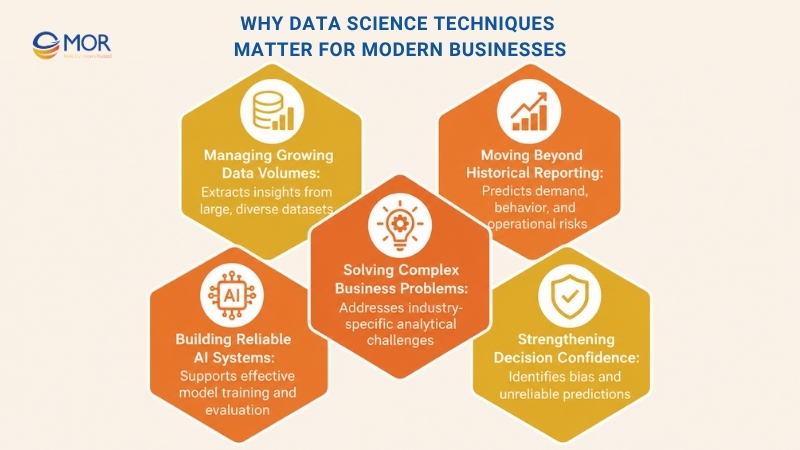
Several business needs explain why these methods are gaining attention:
- Managing growing data volumes: Transaction logs, customer interactions, and IoT sensors generate records that manual reviews cannot process at scale. Statistical analysis and automated data processing reveal useful patterns across these sources.
- Moving beyond historical reporting: Traditional dashboards show previous results. Predictive models estimate future demand, customer behavior, and operational risks so teams can plan upcoming activities.
- Solving complex business problems: Banks analyze suspicious transactions, retailers study buying patterns, and manufacturers monitor machine performance. Each task requires a different analytical approach.
- Building reliable AI systems: Machine learning depends on relevant training data, suitable algorithms, and sound evaluation methods. Data preparation and statistical analysis support these requirements.
- Strengthening decision confidence: Validation helps teams identify misleading correlations, biased samples, and unreliable predictions before applying results to business operations.
The value comes from matching a method to a clear problem. A simple statistical model may answer a business question better than a complex neural network when the available data is limited.
15 Core Data Science Techniques and Their Applications
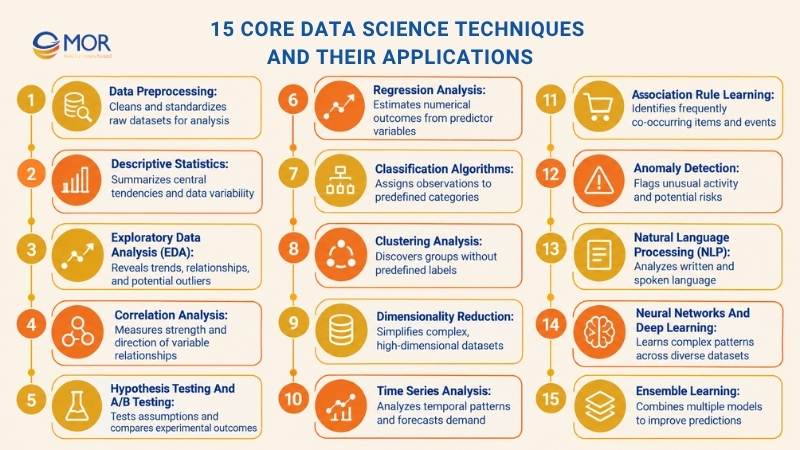
The following data science techniques and applications cover the main stages of data analysis, including preparation, statistical modeling, pattern recognition, and AI development.
No fixed list of basic data science techniques fits every project. Still, these 15 methods provide a practical starting point for understanding how organizations work with data.
1. Data preprocessing
Data preprocessing prepares raw information for statistical analysis and machine learning. Real datasets often contain missing values, repeated records, inconsistent formats, and errors that can distort model results.
A 2025 SoftServe study found that 58% of surveyed business leaders said their organizations made key decisions using inaccurate or inconsistent data most of the time or always. Reliable preparation helps prevent these problems from entering analytical systems.
Common data preprocessing techniques in data science include:
- Missing-value handling: Remove incomplete records or estimate missing values through suitable imputation methods
- Duplicate detection: Identify repeated entries and distinguish accidental copies from legitimate repeated transactions
- Normalization and scaling: Adjust numerical variables to comparable ranges when algorithms depend on their relative scale
- Categorical encoding: Convert text categories into numerical representations through one-hot or ordinal encoding
- Feature preparation: Create, select, or transform variables that help a model recognize meaningful relationships
Consider a company storing customer information across its CRM, website, and mobile application. Preprocessing standardizes customer identifiers, fixes inconsistent formats, and prepares records for analysis.
These steps form the basis of data preprocessing in machine learning, where data quality directly affects the information a model receives.
2. Descriptive statistics
Descriptive statistics summarize the main characteristics of a dataset. They help analysts understand typical values, differences between observations, and the overall distribution of recorded information.
Businesses often start with descriptive statistics before applying more complex data analytics techniques. The results establish a reference point for further investigation.
Common measurements include:
- Mean: Calculates the arithmetic average of a set of values
- Median: Identifies the middle observation and is less sensitive to extreme values
- Mode: Finds the most frequently occurring value or category
- Variance: Measures how widely observations differ from the average
- Standard deviation: Expresses data spread in the original measurement units
- Percentiles: Divide observations into ranked groups to examine distribution patterns
Consider monthly customer spending at an online store. The mean shows average spending, but a few large orders can pull that figure upward.
The median gives another view of typical customer behavior. Comparing these measurements helps the business understand purchasing patterns before making pricing or marketing decisions.
3. Exploratory data analysis (EDA)
Exploratory data analysis examines datasets before formal modeling. Analysts use visualizations and summary measures to find unusual observations, trends, relationships, and potential data-quality problems.
EDA also helps determine which variables deserve closer attention. Unexpected patterns may lead to new hypotheses or reveal errors that need correction.
Common EDA methods include:
- Histograms: Display the frequency distribution of numerical values
- Scatter plots: Show relationships between two numerical variables
- Box plots: Summarize distributions and highlight possible outliers
- Correlation heat maps: Present pairwise relationships across several variables
- Grouped analysis: Compare data across customer segments, regions, products, or periods
For example, a retailer might examine sales across months and discover recurring peaks around major shopping events. A time-based visualization makes this pattern easier to identify than reviewing individual transactions.
EDA doesn't prove why a pattern occurs. It identifies questions worth testing through statistical methods or predictive models.
4. Correlation analysis
Correlation analysis measures the direction and strength of relationships between variables. It helps analysts determine whether two measurements tend to move together.
This method is useful when examining customer behavior, financial indicators, operational performance, and other relationships within structured datasets.
The main approaches include:
- Pearson correlation: Measures the strength of a linear relationship between numerical variables
- Spearman correlation: Measures rank-based relationships, including many monotonic patterns
- Correlation matrices: Summarize relationships among several variables for further analysis
- Correlation testing: Assesses uncertainty when estimating relationships from sampled data
A marketing team might find that higher advertising spending is associated with increased sales. Yet the relationship could also reflect seasonal demand or other factors.
Correlation alone cannot establish that advertising caused the increase. Businesses need controlled experiments or suitable causal methods to investigate that claim.
5. Hypothesis testing and A/B testing
Hypothesis testing examines whether sample data provides evidence against a defined statistical assumption. A/B testing applies experimental design to compare outcomes between groups exposed to different conditions.
These methods help businesses evaluate proposed changes before adopting them across an entire operation.
Common techniques include:
- Statistical hypothesis testing: Compare observed data against a null hypothesis using tests suited to the data
- Confidence intervals: Express uncertainty around an estimated parameter or effect
- T-tests: Compare means under appropriate assumptions
- Chi-square tests: Examine relationships between categorical variables
- Randomized A/B testing: Assign participants to control and treatment groups to estimate the effect of an intervention
Consider an e-commerce business testing two checkout layouts. Visitors are randomly assigned to each version, and the company compares purchase conversion rates.
The analysis should examine effect size, uncertainty, and sample size. A small p-value alone doesn't tell managers whether the improvement is worth implementing.
6. Regression analysis
Regression analysis models relationships between a dependent variable and one or more predictors. It is commonly used to estimate numerical outcomes, study associations, and support forecasting.
Among data science modelling techniques, regression remains a practical starting point because many models are straightforward to train and interpret.
Common approaches include:
- Linear regression: Estimates a numerical outcome using a linear relationship
- Multiple linear regression: Uses several predictors to estimate one numerical target
- Ridge regression: Adds L2 regularization to control coefficient size
- LASSO regression: Uses L1 regularization, which can shrink some coefficients to zero
- Polynomial regression: Represents nonlinear patterns through transformed input variables
A property company might estimate housing prices using floor area, location, age, and nearby services. Regression helps identify how these variables relate to the target price.
Model quality depends on the relationships present in the data and the assumptions of the selected approach. MAE, RMSE, and residual analysis help assess prediction errors.
7. Classification algorithms
Classification assigns observations to predefined categories using labeled training data. It is widely used when businesses need to identify customer groups, detect known fraud patterns, or classify incoming information.
For instance, a churn model can predict whether a customer is likely to cancel a subscription. The model may return a class label or a probability that supports retention planning.
Popular classification methods include:
- Logistic regression: Estimates class probabilities, commonly for binary outcomes
- Decision trees: Create branching rules based on input variables
- Random forests: Combine many decision trees to improve generalization
- Naive Bayes: Uses probability estimates under conditional independence assumptions
- Support vector machines: Construct decision boundaries between classes
- K-nearest neighbors: Classify observations based on nearby labeled examples
Different algorithms suit different data conditions. Our comparison of random forest vs decision tree explains two related tree-based approaches.
For further details, review how a support vector machine separates classes and how the nearest neighbor algorithm uses similarity.
8. Clustering analysis
Clustering groups observations according to shared characteristics without requiring predefined target labels. It belongs to unsupervised machine learning and helps analysts discover patterns that may not be visible through standard reporting.
Companies apply clustering to customer segmentation, behavioral analysis, and exploratory research.
Common methods include:
- K-means clustering: Divides observations into a specified number of clusters based on distance to cluster centers
- Hierarchical clustering: Builds nested groups that reveal relationships at different levels
- DBSCAN: Finds dense groups and identifies observations in sparse regions as noise
- Gaussian mixture models: Represent data as a mixture of probability distributions, allowing soft cluster assignments
Consider a retail business analyzing purchase frequency, average order value, and product preferences. Clustering could identify frequent shoppers, occasional buyers, and customers who prefer discounted products.
These groups can guide marketing analysis, but analysts still need to confirm that the clusters represent meaningful business segments.
9. Dimensionality reduction
Dimensionality reduction transforms high-dimensional datasets into representations containing fewer variables. It helps analysts manage complex information, inspect hidden structures, and sometimes improve model training speed.
The method becomes useful when datasets contain many correlated or redundant inputs. Still, removing dimensions may discard information that matters for the target task.
Common approaches include:
- Principal Component Analysis (PCA): Creates new orthogonal components that capture as much data variance as possible
- T-distributed Stochastic Neighbor Embedding (t-SNE): Projects high-dimensional observations into lower-dimensional spaces, mainly for visualization
- Feature selection: Retains a subset of original variables based on their relevance
- Singular Value Decomposition (SVD): Decomposes matrices and supports compression and latent structure analysis
For example, a manufacturer collecting hundreds of sensor measurements may use PCA to explore whether fewer components capture most of the observed variation.
PCA and feature selection serve different purposes. PCA creates transformed variables, whereas feature selection preserves original inputs.
10. Time series analysis
Time series analysis studies observations recorded in chronological order. Unlike standard regression on independent records, time-based methods account for trends, seasonality, and dependence between observations.
These techniques support forecasting in retail, finance, logistics, energy, and manufacturing.
Common methods include:
- Moving averages: Smooth short-term fluctuations to reveal broader movements
- Exponential smoothing: Assign greater weight to recent observations when forecasting
- ARIMA: Models time-series dependence through autoregression, differencing, and moving-average components
- Seasonal models: Account for recurring patterns across weeks, months, or other periods
- Time-based validation: Evaluates forecasts using earlier observations to predict later ones
A logistics company might analyze past order volumes to estimate demand for warehouse space during upcoming months. Seasonal patterns help managers prepare staffing and inventory plans.
Forecasts still need regular evaluation. Changes in customer behavior or market conditions can weaken previously reliable patterns.
11. Association rule learning
Association rule learning identifies items or events that frequently occur together within datasets. Retailers commonly apply it to market basket analysis, product placement, and cross-selling research.
The Apriori algorithm is a familiar approach for finding frequent item combinations and generating association rules.
Key measurements include:
- Support: Measures how often an item combination occurs within the dataset
- Confidence: Measures how frequently the consequent appears when the antecedent occurs
- Lift: Compares the observed association against what would be expected under independence
- Frequent itemsets: Identify recurring combinations that can form the basis of association rules
A supermarket might analyze transactions and discover that customers who purchase certain ingredients also tend to buy related cooking products.
The business can test product placement or bundled promotions based on those associations. Purchase combinations alone don't establish that one product causes sales of another.
12. Anomaly detection
Anomaly detection identifies observations that differ substantially from expected patterns. It supports risk monitoring when unusual activity may indicate errors, fraud, security threats, or equipment faults.
The approach works particularly well when unusual events are rare or difficult to label in advance.
Common algorithms include:
- Isolation Forest: Identifies unusual observations through random partitioning
- One-Class SVM: Learns a boundary around typical observations
- Autoencoders: Use reconstruction error to flag observations that differ from learned patterns
- Statistical thresholding: Marks values beyond defined distribution limits for investigation
A payment system might flag a transaction that differs sharply from a customer's typical spending activity. A security team can then combine the anomaly score with other evidence before taking action.
Anomalies are not automatically errors. Legitimate events, including unusually large purchases, may also fall outside normal patterns.
13. Natural language processing (NLP)
Natural language processing helps computers analyze and work with written or spoken language. Businesses use NLP to process customer feedback, support messages, contracts, and internal documents.
Text often contains meaning that ordinary numerical analysis cannot capture without further processing.
Common NLP methods include:
- Tokenization: Divides text into smaller units for processing
- Sentiment analysis: Estimates positive, negative, or neutral sentiment
- Named entity recognition: Identifies entities including names, organizations, and locations
- Text classification: Assigns documents or messages to predefined categories
- Embeddings: Represent text in numerical vectors that capture learned patterns of similarity
- Transformer models: Process language through attention-based neural architectures
For example, a customer service team might categorize thousands of support requests according to issue type. NLP helps route requests to suitable teams and identify recurring complaints.
Model performance varies across languages, writing styles, and specialized terminology. Testing should use samples that match the intended operating environment.
14. Neural networks and deep learning
Neural networks learn complex relationships through layers of connected computational units. Deep learning uses neural networks with several processing layers to represent patterns in images, language, audio, and other data.
These methods are often considered when simpler approaches cannot capture the structure of a problem adequately.
Common architectures include:
- Feedforward neural networks: Map structured inputs to outputs through connected layers
- Convolutional neural networks (CNNs): Learn spatial patterns, commonly in image analysis
- Recurrent neural networks (RNNs): Process sequential information through recurrent connections
- Transformers: Use attention mechanisms to model relationships across input sequences
A quality inspection system, for instance, may analyze camera images to identify visible product defects. The model learns visual differences using labeled training images.
Deep learning typically requires careful training, validation, and resource planning. Its higher computational cost needs to be justified by measurable improvements over simpler models.
15. Ensemble learning
Ensemble learning combines predictions from several models to improve accuracy, stability, or generalization. It is useful when individual algorithms capture different aspects of a dataset.
The concept gained wider attention through recommendation-system research. During the Netflix Prize competition, the winning team achieved the contest's target of a 10% improvement over Netflix's original recommendation system.
The main ensemble approaches include:
- Bagging: Trains models on different samples and combines their predictions
- Boosting: Builds models sequentially, focusing on correcting errors from earlier stages
- Stacking: Trains another model to combine predictions from base models
- Random forests: Aggregate predictions from decision trees trained with randomized data and feature selection
- Gradient boosting: Builds successive models to minimize a defined loss function
Businesses use ensemble models for credit risk assessment, demand forecasting, and customer churn prediction.
Greater complexity can improve results, but it may also increase training costs and make predictions harder to explain. Comparing ensembles against simpler baselines helps determine whether the extra effort is justified.
How Machine Learning Powers Modern Data Science Techniques
Machine learning extends data science techniques by allowing systems to learn relationships from historical observations and apply those relationships to new data. It supports automated classification, forecasting, pattern recognition, and other analytical tasks.
The modeling techniques data science teams select depend on the available labels, input data, and desired output. The distinction also affects how teams train, validate, and deploy their models.
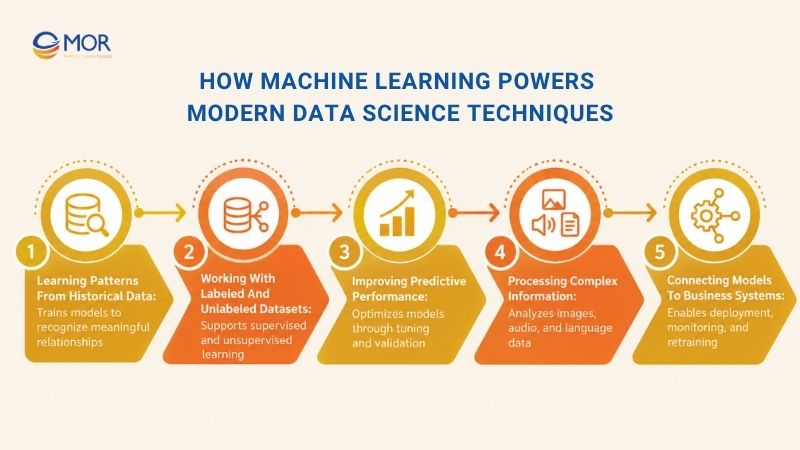
- Learning patterns from historical data: Models adjust their parameters during training to minimize errors or meet other objectives. The chosen machine learning algorithms determine how those relationships are represented.
- Working with labeled and unlabeled datasets: Supervised methods learn from known target values, whereas unsupervised methods find structure without predefined outcomes. Understanding supervised vs unsupervised machine learning helps teams select suitable learning approaches.
- Improving predictive performance: Feature selection, hyperparameter tuning, and cross-validation help teams compare models. A separate test dataset provides a final check against previously unseen records.
- Processing complex information: Deep learning can learn patterns within images, audio, and language data. Such models are useful when manual feature design becomes difficult.
- Connecting models to business systems: MLOps practices support deployment, monitoring, version control, and retraining. Production monitoring tracks whether model performance changes as new data arrives.
A real example comes from Google DeepMind's data center cooling project. In 2016, Google reported that its machine learning system cut cooling energy use by up to 40% by analyzing operational sensor data and predicting system conditions.
Python remains a common language for this work. Teams exploring python for machine learning often use pandas, scikit-learn, TensorFlow, or PyTorch.
Machine learning also represents one part of a broader technical field. Our comparison of data science vs machine learning vs AI helps explain how these areas relate to statistical analysis and intelligent software.
How to Choose the Right Data Science Technique
Choosing the right data science technique starts with defining the question that needs an answer. A customer churn problem requires a different approach from demand forecasting, customer segmentation, or an experiment testing a new product feature.
Data characteristics also affect the decision. Labeled outcomes support supervised learning, whereas unlabeled records may require clustering or exploratory methods.
The table connects common business objectives with suitable techniques and practical selection criteria.
Business objective | Recommended technique | Selection consideration |
Understand past performance | Descriptive statistics, EDA | Data accuracy, completeness, and relevant metrics |
Predict numerical outcomes | Regression | Available target data and acceptable prediction error |
Predict categories | Classification | Class imbalance, labeling quality, and error costs |
Discover customer segments | Clustering | Meaningful variables and similarity measures |
Forecast future demand | Time series analysis | Historical coverage, seasonality, and changing trends |
Detect unusual activity | Anomaly detection | False positive rates and expected behavior |
Analyze customer text | NLP | Language support, text quality, and classification accuracy |
Test business changes | A/B testing | Randomization, sample size, and measurable outcomes |
After identifying suitable methods, compare them against the project's technical and business requirements.
- Define the expected output: Decide whether the business needs a numerical forecast, category, customer segment, or estimated intervention effect
- Assess data readiness: Examine record volume, missing values, data consistency, and access to historical labels
- Review operational requirements: Consider processing speed, computational cost, interpretability, and integration needs
- Choose evaluation metrics: Use precision and recall for relevant classification tasks or MAE and RMSE for numerical predictions
- Establish a baseline: Compare complex models against simpler methods before committing additional resources
- Plan production evaluation: Determine how model quality will be monitored after deployment
The best data science techniques match the decisions a business needs to make. Higher model accuracy has limited value if predictions arrive too late or cannot be integrated into existing operations.
Tangible Business Outcomes of Data Science Techniques
Businesses apply data science techniques to solve problems they can measure through operational and financial KPIs. The results often appear in more accurate forecasts, better fraud detection, faster service processes, and improved customer targeting.
Real deployments also show how specific methods support practical results. In a 2024 announcement, Mastercard reported that its generative AI technology doubled the speed at which it could detect potentially compromised payment cards.
The table connects common data science applications to their expected outcomes and performance measures.
Business application | Data science approach | Expected business outcome | KPIs to measure |
Customer retention | Churn classification | Better targeting of retention campaigns | Churn rate, customer retention rate |
Fraud prevention | Classification, anomaly detection | Earlier identification of suspicious activity | Fraud losses, precision, false positive rate |
Sales forecasting | Regression, time series analysis | More accurate demand and inventory planning | Forecast error, inventory turnover |
Personalized recommendations | Clustering, recommendation models | More relevant product suggestions | Conversion rate, average order value |
Predictive maintenance | Anomaly detection, regression | Fewer unplanned equipment failures | Downtime hours, maintenance costs |
Customer service | NLP, text classification | Faster support request routing | Resolution time, handling cost |
These results depend on the quality of input data, model design, and deployment conditions. A model that performs well during testing may deliver weaker results when customer behavior or operating conditions change.
Business teams should compare KPIs before and after implementation using an appropriate evaluation design. For causal claims, controlled experiments or comparable methods are needed to separate model-related changes from outside factors.
How MOR Software Applies Data Science in Software Projects
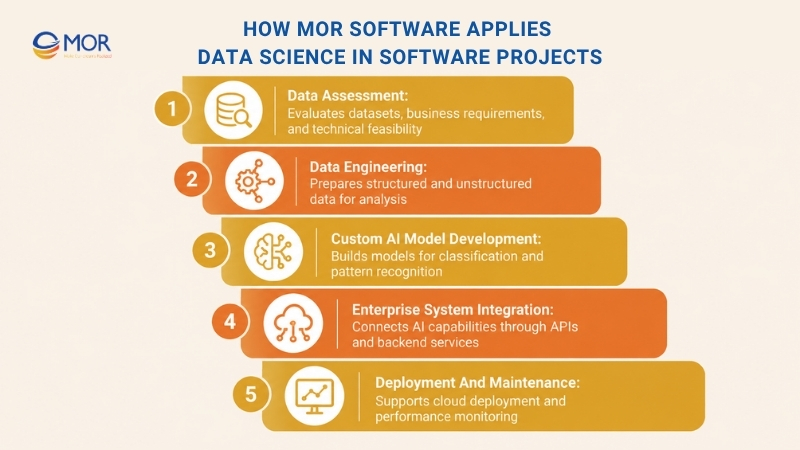
At MOR Software, we combine data engineering, AI development, and software integration to help businesses turn complex information into practical solutions. Our AI development services cover feasibility assessment, data preparation, custom model development, and deployment support. We assess each project's objectives, existing systems, and technical requirements before selecting a suitable approach.
Our experience includes Hospital Review and Job Platform With AI-Driven Spam Filtering, a project developed for a Japanese company that helps nurses review hospital working conditions and find job opportunities. The platform required reliable review management, spam detection, and scalable infrastructure. Our team trained AI models to identify and filter spam reviews, integrated performance monitoring tools, and used AWS to support the platform's growth.
Data engineering is another area of our work. In our Salesforce legacy-system integration project, we connected Salesforce with an existing workforce attendance system through API Gateway and ETL workflows. Our engineers implemented bidirectional data synchronization and migrated historical records, improving data accuracy and access to workforce information.
We also support businesses applying data science techniques through several related capabilities:
- Data assessment: Review business objectives, existing datasets, technical dependencies, and project feasibility before development begins
- Data engineering: Collect, clean, annotate, and prepare structured and unstructured information for analysis and AI development
- Custom AI model development: Build models that address defined business requirements, including classification and pattern recognition
- Enterprise system integration: Connect data workflows and AI functions with existing applications through APIs and backend services
- Deployment and maintenance: Support testing, cloud deployment, performance monitoring, and ongoing software improvements
Our engineering teams work with Python, cloud infrastructure, and enterprise software platforms to develop solutions suited to each client's requirements. We focus on building reliable data foundations, selecting appropriate technologies, and connecting AI capabilities to the systems businesses already use.
Conclusion
Data science techniques give businesses practical ways to analyze information, forecast outcomes, and improve decision-making. The right approach depends on data quality, business objectives, and the results each model can deliver. MOR Software supports companies through data engineering, AI development, and software integration based on their technical needs. If you're planning a data-driven application or AI project, contact us to discuss your requirements and identify a suitable development approach.
"Evolution is not a destination, it is a disciplined journey of innovation."
Phung Van Tu


CEO MOR AI
MOR SOFTWARE
Frequently Asked Questions (FAQs)
What are the most common data science techniques?
Common methods include descriptive statistics, regression, classification, clustering, time series analysis, anomaly detection, and natural language processing. Data preprocessing and exploratory analysis are also widely used because most projects require preparation and investigation before modeling.
What are the main categories of data science techniques?
The main categories include data preparation, statistical analysis, supervised learning, unsupervised learning, and AI-based processing. Model evaluation and validation support these categories by testing the reliability of analytical results.
What is the difference between data science techniques and machine learning?
Data science covers a broader collection of methods for collecting, examining, and interpreting data. Machine learning focuses on algorithms that learn patterns from examples. Statistical summaries and controlled experiments can answer useful questions without training a machine learning model.
Which data science techniques are best for beginners?
Start with descriptive statistics, data cleaning, exploratory data analysis, and linear regression. These methods build a practical foundation for understanding datasets. Common data science tools for beginners include Python, pandas, SQL, and spreadsheet software.
What are the most common statistical techniques in data science?
Descriptive statistics, correlation analysis, regression, hypothesis testing, and confidence intervals are widely used. Each answers a different question about data. Some summarize observations, whereas others estimate relationships or quantify uncertainty.
Which data science techniques are used for predictive analytics?
Regression, classification, time series forecasting, and ensemble learning are common predictive methods. The choice depends on the target. Regression predicts numerical values, classification estimates categories, and time series analysis handles time-dependent observations.
How do classification and clustering techniques differ?
Classification uses labeled examples to assign new observations to predefined categories. Clustering examines unlabeled data and groups observations according to similarity. Customer churn prediction is a classification task, whereas discovering purchasing segments is a clustering task.
Can data science techniques be used without machine learning?
Yes. Descriptive statistics, correlation analysis, hypothesis testing, and many forms of exploratory analysis don't require machine learning. These methods remain useful for business reporting, research, and decision support when complex predictive models aren't needed.
Which industries benefit the most from data science techniques?
Finance, retail, healthcare, manufacturing, logistics, and telecommunications use data science for different purposes. Applications include fraud detection, patient-data analysis, demand forecasting, predictive maintenance, and network monitoring. Results depend on each organization's data maturity and operational goals.
How do businesses measure the success of data science techniques?
Success should be measured against the intended business objective. Model metrics may include accuracy, precision, recall, MAE, or RMSE. Business KPIs can include forecast error, customer retention, fraud losses, operating costs, and time saved.
Share


Make Our-Dreams Realized


© 2023 . MOR Software. All Rights Reserved
Sitemap
Privacy Policy
Terms of Use

Rate this article
0
over 5.0 based on 0 reviews
Your rating on this news:
Name
*Email
*Write your comment
*Send your comment
1